Why Most Modernization Business Cases Get Killed
The investment case for application modernization is rarely the problem. The business case structure is.
Most modernization proposals present ROI as a single aggregate percentage materializing somewhere between three and five years out. PwC’s research on enterprise application modernization confirms the predictable outcome: programs with ROI horizons stretching that far lose executive patience and get cancelled before they deliver [1]. The projection may be accurate. It is also unfundable.
The pattern holds across industries. The primary failure point in most modernization programs is not technical. It is the disconnect between how engineering teams present value and how finance leadership evaluates it. Engineering presents a distant aggregate return. Finance needs value at intervals that they can measure against competing budget requests. These two languages do not meet.
This article presents a different structure. Application modernization ROI is not a single number. It is three conversations at three time horizons, quantified across three distinct value categories, with honest accounting for the transition period where total costs increase before they decrease.
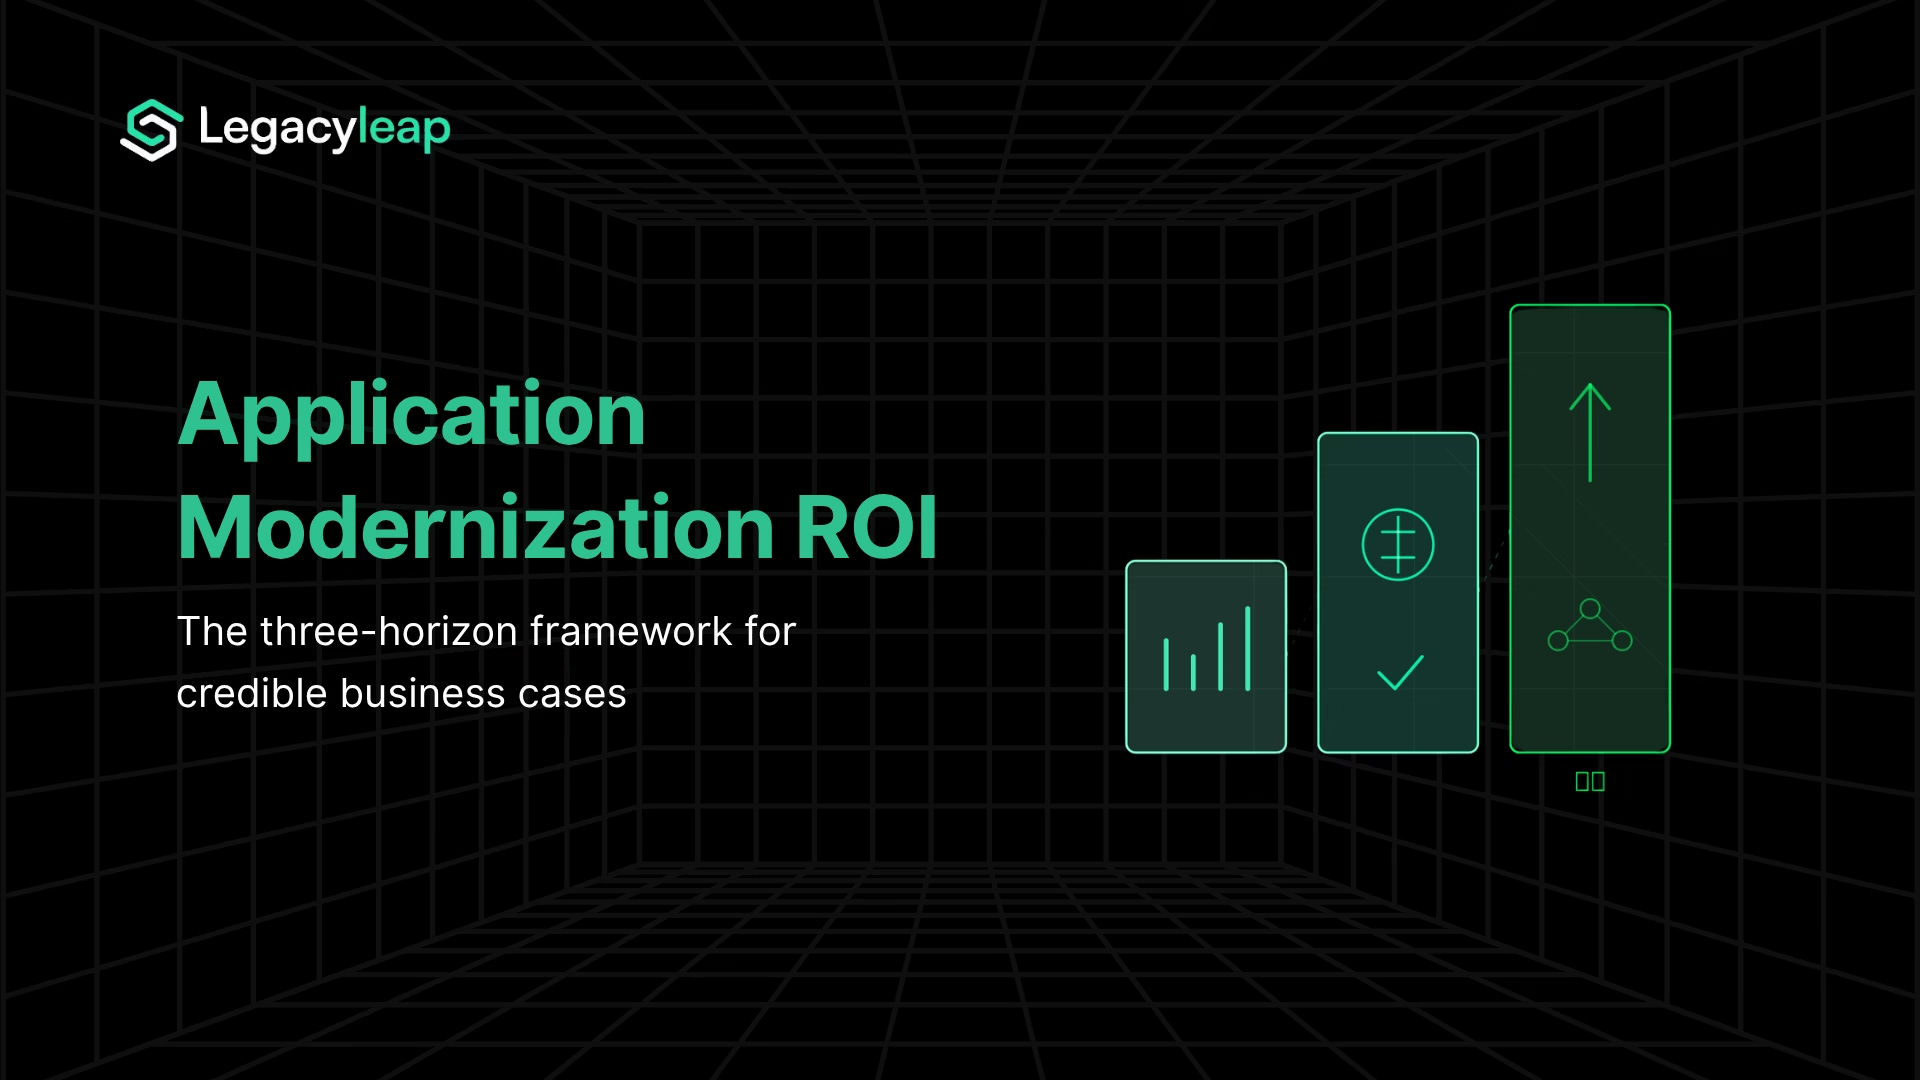
The Three-Horizon ROI Framework: Early Wins, Break-Even, Profitability
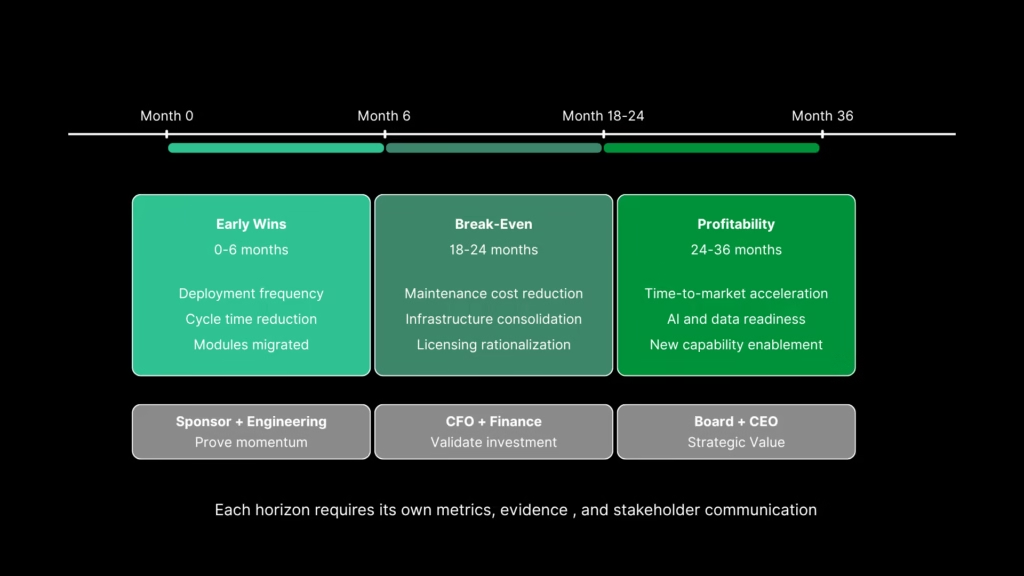
A credible modernization business case separates returns into three distinct horizons, each with its own metrics, evidence, and stakeholder audience. Presenting all three as a single number guarantees that at least one critical audience loses confidence in the projection.
Horizon 1: Early Wins (0–6 Months)
The survival horizon. The goal is not full ROI but measurable proof that the program works. Metrics include:
- deployment frequency improvements,
- cycle time reductions,
- first modules migrated,
- documentation coverage achieved.
The audience is the program sponsor and engineering leadership.
Martin Fowler’s documented Strangler Fig case study shows first value delivery in approximately four months versus two years for a full rewrite, with cycle time improving from roughly 20 days to 9–10 days for migrated modules. If you cannot show measurable progress within six months, executive patience erodes regardless of the long-term projection.
The speed at which Horizon 1 delivers depends almost entirely on how quickly the organization completes the comprehension phase. Teams that spend months on manual discovery push the first measurable win further out, weakening the framework before it has a chance to prove itself.
Horizon 2: Break-Even (18–24 Months)
The financial proof point. Cumulative savings from reduced maintenance labor, infrastructure consolidation, and licensing rationalization exceed cumulative investment. The dual-run cost trough (covered below) ends here, and the cost curve inflects.
The audience is the CFO and finance team. Phased modernization approaches typically reach break-even within 18–24 months.
Horizon 3: Profitability and Strategic Value (24–36 Months)
The full business case. Sustained cost reduction combines with new capabilities: faster time-to-market, AI and data readiness, new integration patterns. The audience is the board and CEO.
Phased programs that survive the early horizons generate compounding returns. A single ROI deck fails because different audiences evaluate value at different intervals. A number that satisfies the board is too distant for the CFO, while a number that satisfies the CFO is too granular for the board.
| Horizon | Timeframe | Primary Stakeholder | Key Metrics | Evidence Anchor |
| Early Wins | 0–6 months | Program Sponsor, Engineering Leadership | Deployment frequency, cycle time, modules migrated, documentation coverage | Strangler Fig case study: first value in ~4 months; cycle time from ~20 days to ~10 days |
| Break-Even | 18–24 months | CFO, Finance Team | Cumulative savings vs. cumulative investment, maintenance cost reduction, licensing consolidation | Phased approaches typically break even at 18–24 months as legacy maintenance costs decline and savings accumulate |
| Profitability | 24–36 months | Board, CEO | Sustained cost reduction, time-to-market acceleration, AI/data readiness, new capability enablement | Compounding returns from sustained cost reduction plus new capability enablement (AI readiness, integration patterns, time-to-market acceleration) |
Three ROI Categories Every Business Case Must Quantify Separately
The three-horizon framework answers when ROI arrives. This section answers what kind of ROI to measure. Each category has different measurement methods, different baselines, and different levels of certainty.
Hard Cost Savings
- Infrastructure spend,
- Licensing fees,
- Maintenance labor,
- Ongoing cost of working around accumulated technical debt.
These are line items that exist in current budgets and can be measured before and after modernization.
McKinsey’s research found that tech debt consumes 20–40% of the entire technology estate’s value before any new investment is made, with 10–20% additional cost added to every project that must work around existing debt [3]. One North American bank in the same research faced over $2 billion in accumulated tech-debt costs across more than 1,000 systems.
At the federal level, the U.S. GAO reports that approximately 80% of federal IT budgets go to operations and maintenance, leaving minimal capacity for modernization [4]. Only 3 of 10 critical federal modernization programs had been completed as of early 2025. These are not theoretical projections. They are current, measurable line items.
Revenue Enablement
Time-to-market acceleration, feature velocity, developer productivity gains, and AI readiness. Industry data consistently shows that cost reduction is only one of three primary modernization drivers, alongside customer experience improvement and developer productivity. The cost argument alone captures only one-third of the decision calculus.
The revenue case becomes most compelling when connected to AI readiness. Legacy systems are rarely structured to support LLM integrations, analytics pipelines, or real-time decisioning. Modernization is increasingly a prerequisite for AI initiatives, not a parallel program. Organizations that delay are not just carrying maintenance costs, but are deferring access to capabilities competitors are already building on modern stacks.
Risk Avoidance
Breach cost exposure, compliance risk, and talent continuity. IBM’s 2024 Cost of a Data Breach report puts average breach costs at $4.88 million, a 10% year-over-year increase, with significantly higher figures for organizations running legacy infrastructure [5].
The EU’s Digital Operational Resilience Act (DORA), effective January 2025, is accelerating modernization timelines across financial services.
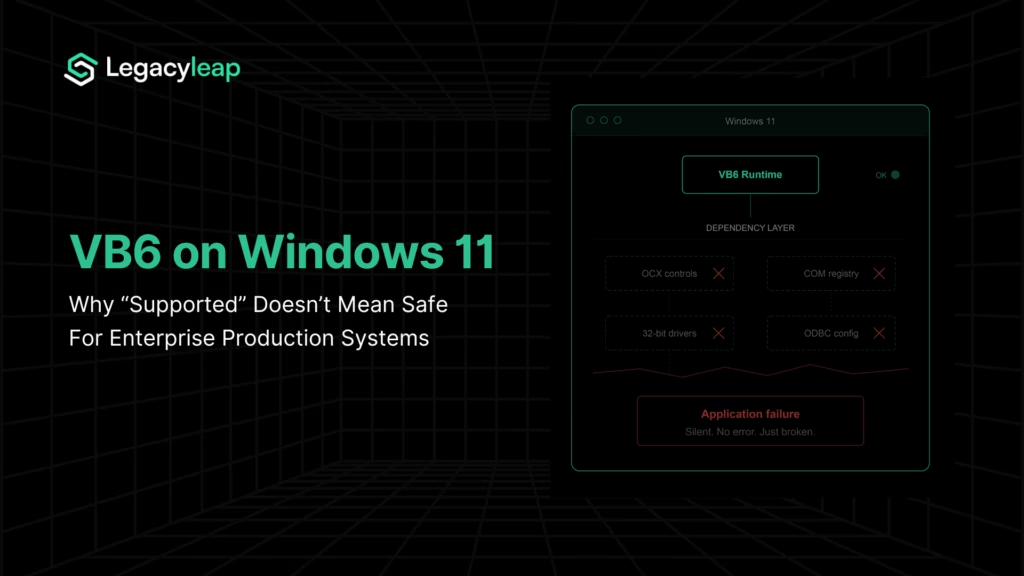
Talent risk is equally concrete. Experienced engineers for VB6, Classic ASP, EJB, Java EE, and similar aging stacks are increasingly scarce. This is a line item that grows every year and becomes a crisis when key personnel leave.
| ROI Category | What to Measure | Baseline Source | Quantification Method |
| Hard Cost Savings | Infrastructure spend, licensing fees, maintenance labor, tech debt carrying cost | Current IT budget line items; vendor contracts; headcount allocation | Before-and-after comparison of measurable spend categories |
| Revenue Enablement | Cycle time, deployment frequency, feature velocity, AI/data readiness | Current release cadence; developer productivity metrics; integration capability inventory | Baseline current metrics, project improvements with evidence from comparable programs |
| Risk Avoidance | Breach exposure, compliance gaps, talent dependency, key-person risk | Industry benchmarks (IBM breach data); regulatory timelines; workforce availability analysis | Probabilistic modeling using industry benchmarks; compliance gap analysis against deadlines |
You now have the framework and the categories. The $0 Modernization Assessment gives you the baseline numbers to populate both.
The Dual-Run Cost Trough: Why Costs Increase Before They Decrease
During phased modernization, the organization operates both legacy and modern systems simultaneously. Any incremental modernization approach (Strangler Fig, parallel processing, modular cutover) requires a period where both systems are live, maintained, and supported. Total costs increase before savings materialize.
This is the dual-run cost trough. It is the expected cost shape of any phased transition, not an indicator of program failure.
McKinsey found that organizations overspend by approximately 14% annually during migration transitions, driven by coordination inefficiencies and incorrect sizing assumptions transferred from on-premises environments [6]. The overspend is predictable and can be planned for. The mistake is not accounting for it.
Any ROI projection showing a clean downward cost curve from day one is not credible. Finance leaders who have been through enterprise transformations will flag this immediately. Acknowledging the trough builds credibility with exactly the audience that matters most.
How to Account for It
Build a J-curve cost projection showing three things: the temporary cost increase, the inflection point, and the break-even timeline. Map these to the three horizons:
- The trough is deepest during Horizon 1, when both systems are fully operational and migration costs are front-loaded.
- The curve flattens during Horizon 2, as modules cut over and legacy maintenance costs decline.
- The curve inverts during Horizon 3, as sustained savings and new capability value compound.
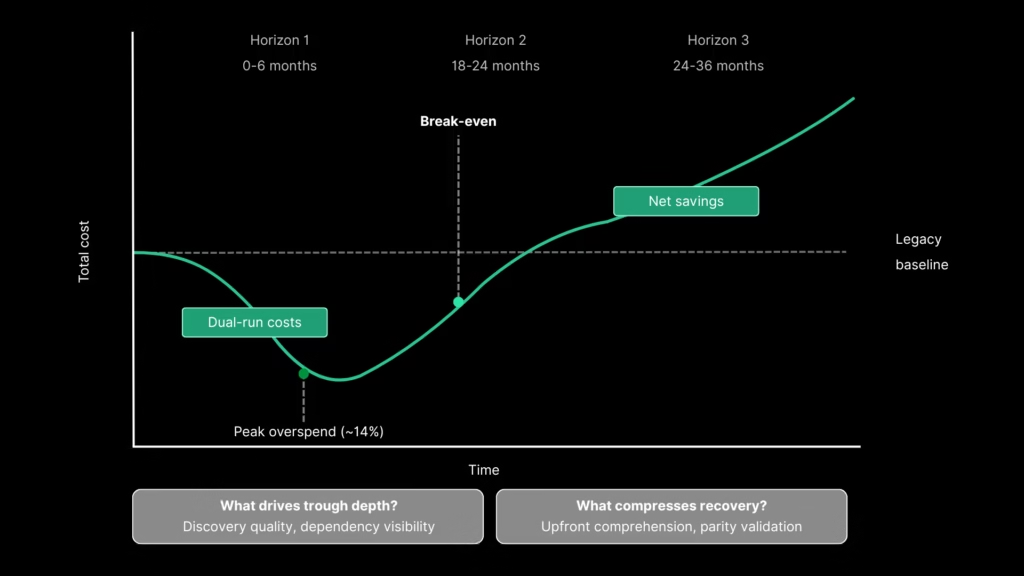
The trough’s duration and depth are directly influenced by upfront assessment quality. Poor discovery extends the dual-run period because dependencies surface mid-transition, forcing extended parallel operation. Compressed comprehension means a shallower trough and a faster path to inflection.
The three-horizon framework works regardless of the execution model. Where timelines compress or expand is in the comprehension phase and validation cycle, and that is where Legacyleap’s specific approach applies.
How Legacyleap Compresses the Path to Modernization ROI
The three-horizon framework is tool-agnostic. It works whether modernization is executed manually, through a services partner, or with a platform. What varies is how long the comprehension phase takes, how deep the dual-run trough gets, and how much calendar time the validation cycle consumes. These are the variables that determine whether the timelines in this framework hold or slip. They are also where Legacyleap’s specific approach applies.
The Reallocation Argument
The $0 Modernization Assessment quantifies the current cost of maintaining the legacy system: dependency complexity, maintenance labor allocation, risk profile, and technical debt concentration. This produces the “before” baseline every credible ROI projection requires.
The reframe is direct. When McKinsey shows 20–40% of estate value consumed by tech debt [3], and the GAO shows 80% of IT budgets going to operations and maintenance [4], the modernization budget already exists.
It is currently labeled “maintenance.” The $0 Assessment makes this visible at the organization-specific level.
Compressing Horizon 1: Faster Time-to-First-Value
- The Assessment Agent maps dependencies, risk areas, and modernization complexity directly from the codebase.
- The Documentation Agent reconstructs missing documentation, workflows, and business rules, replacing months of manual reverse-engineering with grounded, code-derived outputs.
- The Modernization Agent then applies governed, diff-based transformations that are human-reviewable before acceptance. Every change is visible, traceable, and reversible.
Together, these agents compress the comprehension phase from months to weeks, making the 3–6-month early-win horizon realistic rather than aspirational.
For more info on how Legacyleap uses its agents, here’s a detailed read: Agentic AI Application Modernization for Enterprise Systems.
Reducing the Dual-Run Trough Depth
Because comprehension is code-grounded, dependencies surface during assessment rather than mid-migration. Fewer surprises during transition means shorter parallel operation, a shallower cost trough, and a faster path to break-even.
Parity Validation and the Compliance Premium
In regulated industries, a significant portion of compliance costs is driven by manual functional equivalence testing.
Our QA Agent automates parity validation, generating test suites across unit, API, UI, and functional layers and running regression checks against the legacy system’s behavior. This reduces both the cost premium and the calendar time spent on validation, directly improving ROI math for regulated programs.
All transformations are diff-based and require human review before acceptance. Legacyleap does not merge, deploy, or execute code directly. This is structural governance built into the platform.
Reported Outcomes
Across engagements, Legacyleap has reported 40–50% reduction in total modernization effort, with potential for up to 70% on less-coupled codebases with well-defined module boundaries. These are reported engagement outcomes, not guaranteed projections.
Two representative examples:
- A financial services provider modernized a VB6-based core application to C#. The engagement cut development cycles by 40%, enhanced security posture, and enabled third-party integrations that the legacy architecture structurally prevented.
- A fuel distribution software company modernized an aging VB6 system to .NET. The engagement reduced manual effort by 80%, cut costs by 60%, accelerated feature deployment by 40%, and maintained zero downtime throughout.
Building the Business Case That Survives the CFO Review
A credible modernization business case is a structured financial argument, not a single ROI number on a slide. The framework in this article can be summarized as a checklist. A complete modernization business case should contain:
- Three-horizon ROI projection with specific evidence and metrics for each horizon (early wins, break-even, profitability).
- Three ROI categories quantified separately – hard cost savings, revenue enablement, and risk avoidance – each with defined metrics and baseline sources.
- J-curve cost projection accounting for the dual-run cost trough, with the inflection point and break-even timeline clearly mapped.
- Baseline cost data from rigorous assessment – organization-specific dependency maps, risk profiles, and maintenance cost quantification, not estimates extrapolated from industry averages.
- Stakeholder-to-horizon mapping showing who evaluates value at each interval and what evidence they need to sustain support.
For cost estimation methodology and ROM inputs that feed into this framework, see our companion guide on What Does Application Modernization Cost in 2026? A ROM Estimation Guide for Enterprise Leaders.
The business case starts with accurate baselines. The $0 Modernization Assessment produces the dependency map, risk profile, effort ranges, and maintenance cost baseline the three-horizon framework requires.
Request a $0 Modernization Assessment →
For organizations ready to see how Legacyleap’s agent-driven workflow compresses the comprehension and transformation phases described in this article:
FAQs
Start with the applications that consume the most maintenance budget relative to the business value they deliver. The three-horizon framework depends on demonstrating early wins within six months, which means the first candidates should be systems where modernization produces visible, measurable improvement quickly – reduced cycle time, lower incident rates, or consolidated infrastructure. Avoid starting with the most complex or most critical system. High-complexity applications carry more risk of extending Horizon 1 beyond the window where executive patience holds. The better approach is to sequence by a combination of maintenance cost, business criticality, and migration complexity, prioritizing systems that are expensive to maintain but structurally straightforward to modernize. Early wins on these systems build the credibility and organizational momentum needed to tackle harder migrations later.
Most organizations underestimate their true legacy maintenance costs because they are distributed across infrastructure, licensing, headcount, and incident response budgets rather than consolidated under a single line item. An accurate baseline requires aggregating all of these: hosting and infrastructure costs, software licensing, the percentage of engineering headcount allocated to maintenance versus new development, vendor support contracts, and the cost of workarounds and incidents caused by legacy limitations. Without this, ROI projections are built on estimates that finance leadership will challenge. Legacyleap’s $0 Assessment produces this baseline by mapping dependency complexity, maintenance labor allocation, and technical debt concentration directly from the codebase, converting what is typically a months-long manual discovery exercise into a structured output.
Each audience evaluates value at a different interval and needs different evidence. Engineering leadership tracks Horizon 1 metrics: modules migrated, deployment frequency, cycle time improvements, documentation coverage. These are leading indicators that the program is executing. The CFO tracks Horizon 2 metrics: cumulative savings versus cumulative investment, maintenance cost reduction trends, infrastructure consolidation progress. These are the financial proof points that justify continued funding. The board tracks Horizon 3 outcomes: strategic capability enablement, AI and data readiness, time-to-market acceleration, and competitive positioning. A single ROI deck that mixes all three creates confusion rather than confidence. The most effective approach is a tiered reporting cadence where each stakeholder group receives metrics calibrated to the horizon they are responsible for evaluating.
The most frequent cause is incomplete discovery. When dependency mapping is shallow or manual, hidden integrations and undocumented business logic surface mid-migration, forcing extended parallel operation while teams investigate and resolve issues that should have been identified upfront. The second common mistake is migrating in an order that maximizes rather than minimizes interdependencies. Cutting over a module that five other systems depend on before those dependencies are mapped creates cascading rework. Third, organizations often underinvest in parity validation, deferring functional equivalence testing until late in the cycle, which creates a bottleneck that holds both systems live longer than planned. Legacyleap’s Assessment and Documentation Agents address the first cause directly by surfacing dependencies and reconstructing missing documentation before transformation begins, compressing the window where both systems must run simultaneously.
Cost reduction and AI readiness are not automatically linked. An application can be modernized to a current framework, reduce maintenance costs significantly, and still be architecturally unable to support AI workloads if the modernization did not address data accessibility, API surface area, or integration patterns. AI readiness requires that modernized systems expose clean APIs, support real-time data access, and are structured for integration with analytics pipelines and inference services. This means modernization planning should include target architecture requirements informed by the AI initiatives the organization intends to pursue, not just the technical debt it intends to eliminate. If the modernization roadmap is designed purely around cost reduction, the organization may achieve Horizon 2 savings but miss the Horizon 3 strategic value that justifies the full investment.
References
[1] PwC, “Modernizing Business Applications for Cloud” https://www.pwc.com/us/en/services/consulting/business-transformation/cloud-transformation/application-modernization.html
[2] McKinsey, “Demystifying Digital Dark Matter: A New Standard to Tame Technical Debt” https://www.mckinsey.com/capabilities/mckinsey-digital/our-insights/demystifying-digital-dark-matter-a-new-standard-to-tame-technical-debt
[3] U.S. Government Accountability Office, “Agencies Need to Plan for Modernizing Critical Decades-Old Legacy Systems” (GAO-25-107795) https://www.gao.gov/products/gao-25-107795
[4] IBM Security, “Cost of a Data Breach Report 2024” https://newsroom.ibm.com/2024-07-30-ibm-report-escalating-data-breach-disruption-pushes-costs-to-new-highs
[5] McKinsey, “Cloud-Migration Opportunity: Business Value Grows, but Missteps Abound” https://www.mckinsey.com/industries/technology-media-and-telecommunications/our-insights/cloud-migration-opportunity-business-value-grows-but-missteps-abound